By James P. Gaines, Luis B. Torres, Wesley Miller, and Paige Woodson
June 2018 Summary
Texas housing sales fell 3.2 percent as activity slowed, especially in the $200,000-$300,000 price range. Housing demand, however, remained particularly strong amid the state’s continued economic expansion. Developers accelerated supply-side activity but struggled to match demand. The rate of single-family housing construction significantly lags pre-recessionary peak levels. Homebuilders continued to grapple with increased land, labor, and lumber costs, as well as increased regulations. A flood of new listings across the price spectrum (except for those below $200,000) provided marginal, yet necessary, relief to inventories after stalling last year. While the pause in sales activity moderated price pressures, housing affordability worsened across the state. Overall, the housing market fundamentals were unchanged in Texas, characterized by lagging supply and robust demand.
Supply*
The Texas Residential Construction Cycle (Coincident) Index, which measures current construction activity, reached its highest level since 2008 as construction employment and wages elevated. This momentum should continue through the summer as the Texas Residential Construction Leading Index (RCLI) extended its upward climb amid gains in single-family housing starts and weighted building permits.
In response to housing shortages (primarily for homes priced under $300,000), Texas developers increased supply activity at the earliest stage of the construction cycle. The inventory of vacant developed lots (VDLs) rose 1 percent quarter over quarter (QOQ) in the Texas Urban Triangle, led mostly by 3.3 percent growth in Dallas-Fort Worth (DFW). The VDL inventory flattened in Houston and San Antonio and fell 10.9 percent year to date (YTD) in Austin.
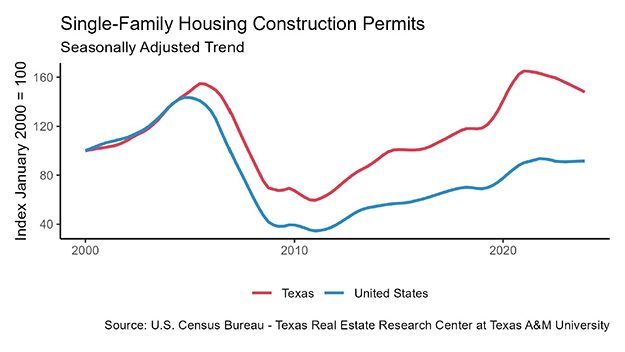
Despite the overall uptick in lot development, single-family housing construction permits (unweighted) fell 1.8 percent in the second quarter, slowing YTD growth to 2.2 percent. Texas remained the national leader with 11,132 nonseasonally adjusted permits issued, accounting for 16 percent of the national total. Houston topped the metropolitan rankings, issuing 3,681 permits, followed by Dallas-Fort Worth at 3,295. Permit activity fell by more than 5 percent QOQ in both of the major metros. Austin held fifth place with 1,726 monthly permits after a 13.7 percent second-quarter increase. The San Antonio MSA, which has 358,000 more residents than Austin, issued just 759 permits.
Total Texas housing starts inched closer to pre-recessionary levels after stepping back in May. Single-family housing starts surged in the major metros, recording double-digit growth YTD across the board. In addition, multifamily investment continued to pour into the North Texas market.
Despite upward trending VDLs and housing starts, single-family private construction values fell 3.7 percent in the second quarter. Construction values dropped 6.9 and 5.4 percent QOQ in DFW and San Antonio, respectively, followed by Houston at 0.1 percent. On the other hand, Austin posted a 2.7 percent quarterly increase, pushing YTD growth above 4 percent.
The Texas months of inventory (MOI) remained constrained but posted its fourth consecutive uptick to 3.7 months. Around six months of inventory is considered a balanced housing market. The recent pause in sales activity and a flood of new MLS listings provided marginal relief to inventory constraints. Housing market imbalances, however, are far from over as demand outpaced the rate of single-family residential development. The recent inventory improvements occurred primarily for homes priced above $300,000 where supply is more stable. In the $200,000-$300,000 price range, the MOI held at 3.1 months, while the MOI for homes priced below $200,000 sank to an all-time low of 2.7 months.
The wave of new listings lifted the MOI across the major metros. Fort Worth maintained the lowest MOI at 2.4 months but reached its highest point in over two and a half years. Austin and Dallas hit YTD highs at 2.6 and 2.9 months, respectively, followed by San Antonio at 3.4 months. Houston was the exception, where steady sales volumes pressured the MOI down to 3.8 months after a three-month increase.
Demand
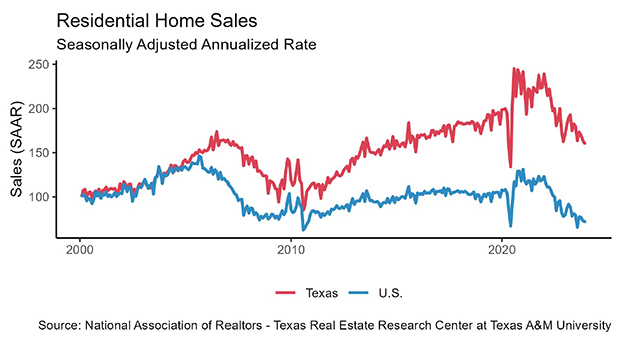
Housing sales fell 3.2 percent in June, pulling the YTD total down 1.9 percent. The softening occurred primarily for homes priced below $300,000, which accounted for two-thirds of sales through Multiple Listing Services (MLS). Sales on homes priced below $200,000 have slid since 2013, but the $200,000-$300,000 price range flourished until this year’s plateau.
This same price cohort hindered the markets in Austin, Dallas, and Fort Worth, where housing affordability declined substantially over the past year. Through the first six months of 2018, total housing sales dropped 9.2 percent in Austin, 5.7 percent in Dallas, and 4.1 percent in Fort Worth. Most of the North Texas decline, however, occurred in the resale market. New-home sales in the second quarter jumped 7.3 percent in DFW, approaching a decade-high. Austin’s new-home sales ticked down 1.2 percent QOQ but hovered closest to pre-recessionary levels. Total sales calmed in San Antonio after reaching record levels in May. In Houston, total sales increased 2.2 percent YTD amid a second-quarter boom in the new-home market.
Despite the pause in closed listings, Texas’ economic expansion bolstered housing demand. The average days on market(DOM) sank below 56 days for the first time since 2015. Austin, Houston, and San Antonio faced similar demand conditions with DOM at 53, 54, and 56 days, respectively. The Dallas DOM fell under 42 days after inching up over the past year, while Fort Worth homes flew off the market at an average of just 38 days.
Statewide, homes priced from $200,000 to $300,000 averaged 50 days on the market, corroborating that housing shortages, not demand, are hindering the market. Demand spilled into this price range as homebuyers struggled to find options priced below $200,000. The bottom price cohort (below $200,000) accounted for the largest proportion of sales through an MLS at 34 percent. In 2011, more than 72 percent of sales fell in this price range. Demand also heightened on the upper-end of the market (above $500,000) where the DOM reached a record low 78 days.
Concerns regarding international trade pulled investments into safe assets, offsetting robust economic data and weighing on interest rates after they reached multiyear highs in May. The ten-year U.S. Treasury bond yield ticked down 7 basis points to 2.91 percent, despite the Federal Reserve’s 25-basis-point increase in the federal funds rate. The Federal Home Loan Mortgage Corporation’s 30-year fixed-rate balanced below 4.6 percent after an eight-month climb. Despite the recent run, mortgage rates have held historically low since the Great Recession.
Prices
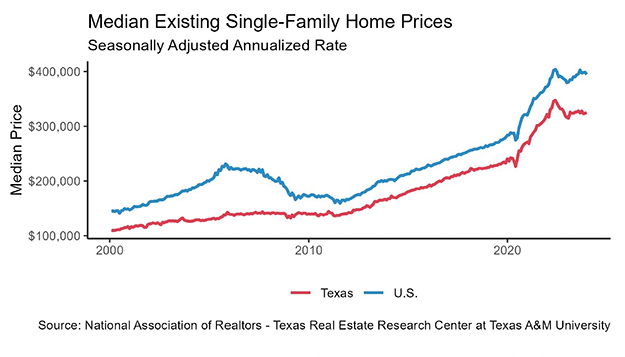
Texas builders reduced home sizes to combat rising land, labor, and lumber costs. The median square footage (sf) of new homes sold through an MLS fell to 2,283 sf, the smallest since 2011. Smaller homes for sale, combined with upticks in inventory, calmed home price appreciation. The Texas median home price fell to a six-month low below $229,000. The median price per square foot (ppsf), however, rose for the 13th consecutive month to a record high $115.53.
Austin led the state with a median price above $306,000, despite having a median square footage of just 2,187 sf for new homes—the lowest of any major Texas metro. As a result, the median ppsf increased $3.84 this year alone to $153.63. Dallas’ median price ($281,348) and ppsf ($131.45) flattened on the year as new-home square footage continued a yearlong slide. A similar phenomenon occurred in Houston, holding the median price and ppsf around $230,000 and $108.35, respectively. Fort Worth’s shift towards smaller homes was even more drastic, pushing the median ppsf above $119.25. Rampant demand and pronounced shortages, however, more than offset the adjustment as the median price increased 8 percent year over year to $233,475. San Antonio maintained the lowest median price of the major metros at $220,100, but its ppsf rose to $113.84.
Despite softening price pressures, the Texas Housing Affordability Index sank below 1.50 in the second quarter, the lowest level since the housing crisis. The index indicated that a Texas family earning the median income could no longer afford homes priced 50 percent above the median sale price. For much of the past decade, Texans enjoyed the capability of affording homes priced nearly twice that of the median. The Dallas index settled at 1.39, the lowest of the major metros, followed by Austin at 1.40. Fort Worth had the largest decline in affordability, matching Houston at 1.63. In San Antonio, the affordability index sank six points to 1.50 in the second quarter.
________________
*All monthly measurements are calculated using seasonally adjusted data, and percentage changes are calculated month over month, unless stated otherwise.


Original article: https://www.recenter.tamu.edu/articles/technical-report/Texas-Housing-Insight


